My Projects

Data projects that turn business questions into clear insights.

These projects show how I clean, analyze, visualize, and explain data using Excel and Power BI.

Project 1

Sales Data Analysis

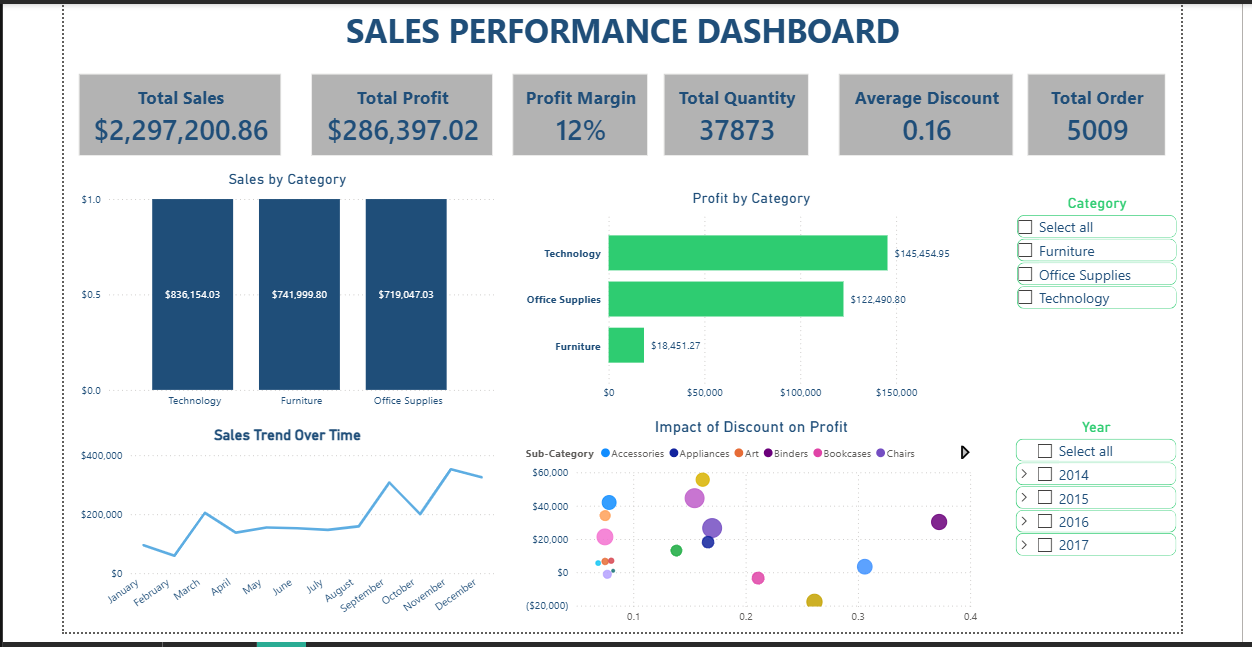
This dashboard provides a comprehensive view of sales performance, profit distribution, and business trends to support data-driven decision making.

Sales performance dashboard showing sales, profit, margin, quantity, discount, and order metrics
Sales Performance Dashboard

Project Overview

This project analyzes sales performance using Power BI to uncover trends, evaluate profitability, and provide actionable business insights.

Business Context

This project helps businesses understand key drivers of revenue, profitability, and customer purchasing behavior.

Problem

Businesses often struggle to understand how sales, profit, and discounts affect overall performance and decision-making.

Tools Used

Excel and Power BI.

Process

  • Cleaned and prepared the dataset for analysis.
  • Built interactive dashboards to track sales, profit, and order trends.
  • Analyzed category performance and discount impact.
  • Visualized key business metrics for decision-making.
Key Metrics

  • Total Sales
  • Total Profit
  • Total Orders
  • Profit Margin
  • Average Discount

Key Insights

  • Technology generated the highest revenue and profit.
  • High discount rates were associated with lower profit margins.
  • Sales performance varied across product categories and time periods.
  • Some categories contributed less to overall profitability.

Recommendations

  • Reduce excessive discounting to improve profit margins.
  • Focus on high-performing product categories for growth.
  • Optimize pricing strategies based on category performance.
  • Monitor underperforming categories and improve marketing strategies.

Project 2

Call Center Performance Analysis

This project analyzes call center operations to evaluate service efficiency, customer satisfaction, and operational performance using Power BI.
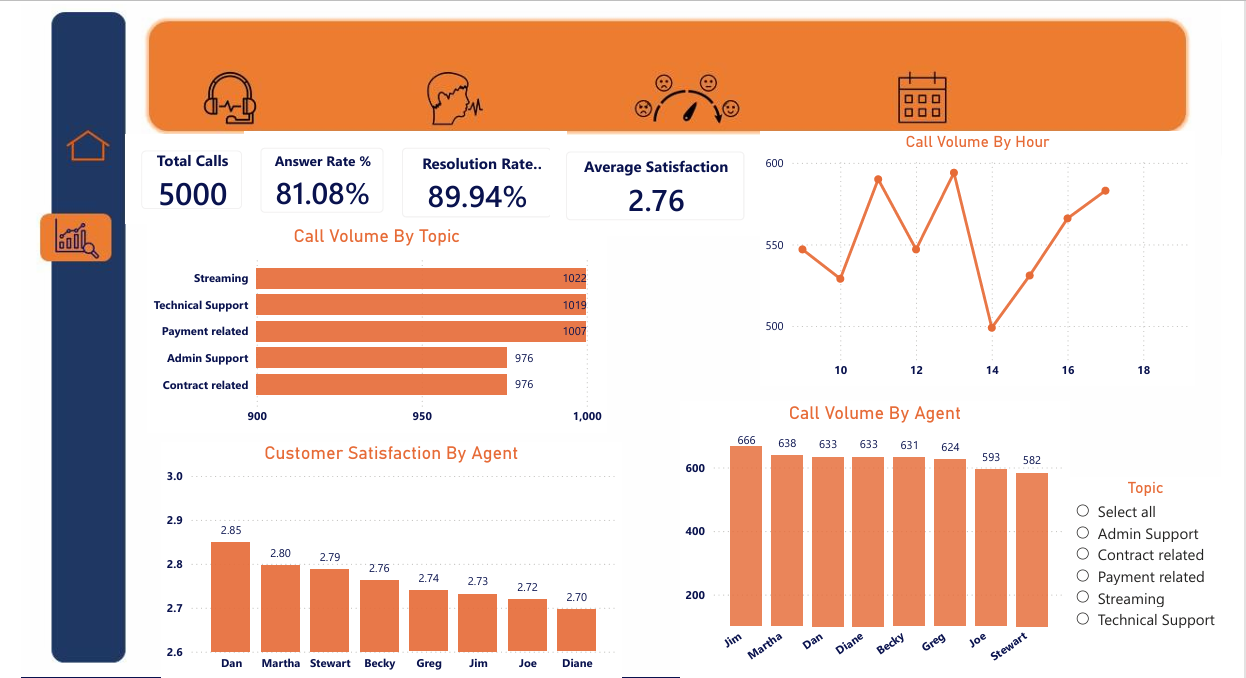
Call center dashboard showing total calls, answer rate, resolution rate, satisfaction, and call volume
Call Center Performance Dashboard

Business Context

Call centers play a critical role in customer experience. Understanding call volume, response rates, and satisfaction levels helps organizations improve service delivery.

Problem

The organization needed to assess how efficiently customer calls were handled and identify factors affecting customer satisfaction.

Tools Used

Power BI and Excel.

Process

  • Cleaned and prepared the call center dataset.
  • Analyzed call volume trends across hours and topics.
  • Evaluated agent performance and workload distribution.
  • Measured customer satisfaction and resolution rates.
  • Built an interactive dashboard for performance monitoring.

Key Metrics

  • Total Calls
  • Answer Rate
  • Resolution Rate
  • Customer Satisfaction Score

Key Insights

  • Answer rate was high at 81%, but some calls were still missed.
  • Resolution rate was strong at 89%, indicating effective problem-solving.
  • Customer satisfaction remained relatively low despite high resolution.
  • Call demand peaked during midday, creating pressure periods.

Recommendations

  • Improve service capacity during peak hours.
  • Focus on improving customer interaction quality.
  • Provide additional training for better customer experience.
  • Optimize staffing based on call demand patterns.

Project 3

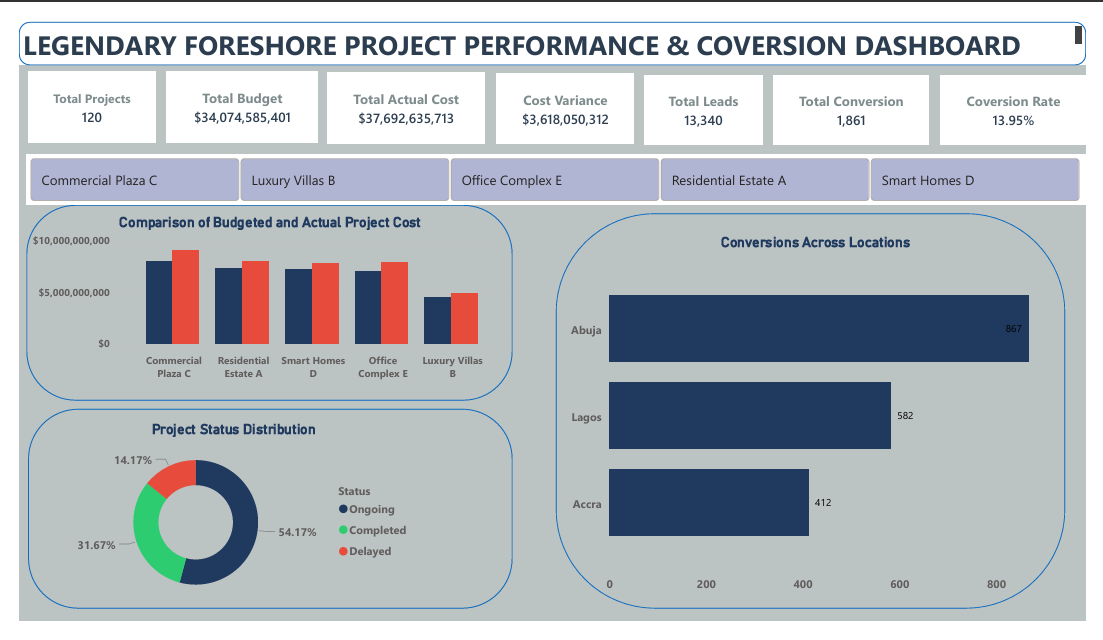
Legendary Foreshore Project Performance & Conversion Dashboard

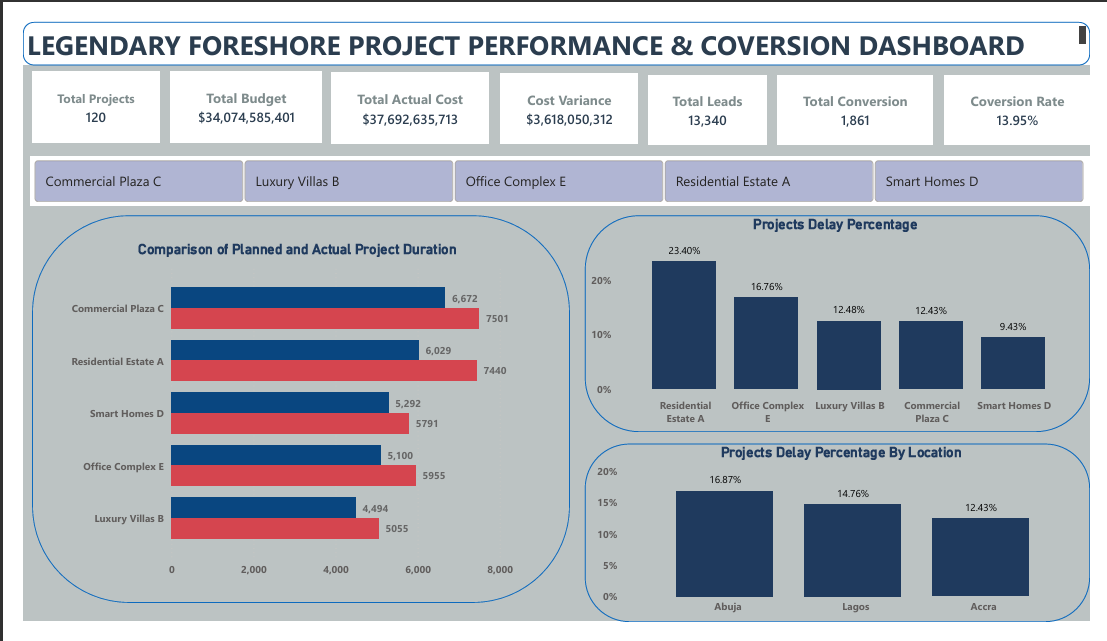
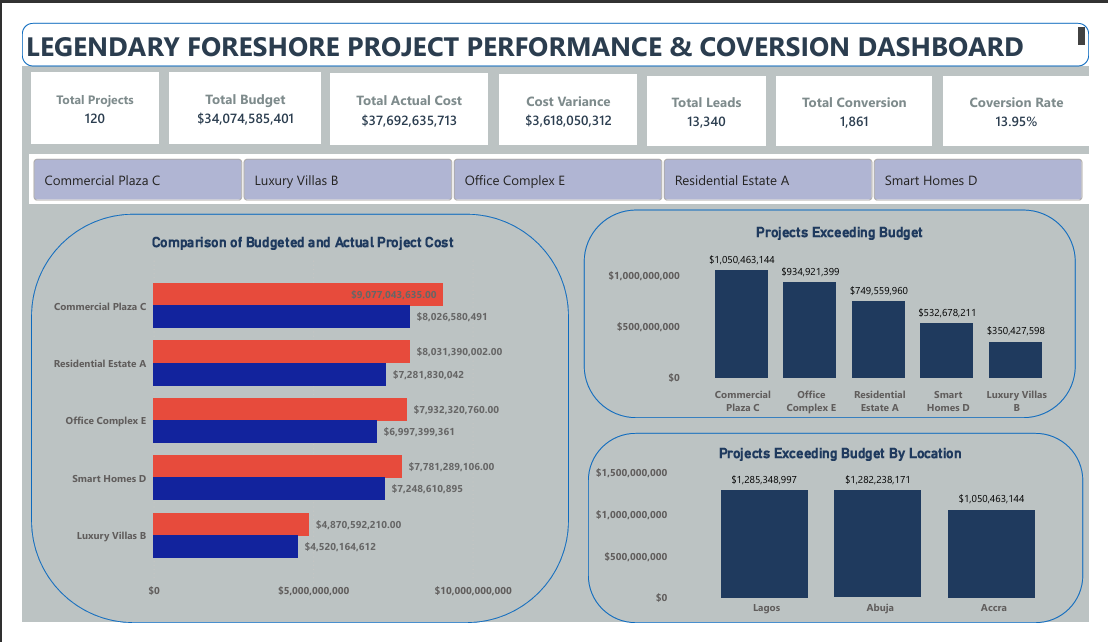
This project analyzes real estate project performance by examining project budgets, actual costs, lead generation, conversions, project delays, and overall delivery performance.
Business Context

Real estate organizations need to track budgets, actual costs, delays, lead conversion, and regional project performance in one place.

Objectives

  • Compare budgeted costs against actual costs.
  • Identify projects exceeding budget.
  • Analyze completion, delays, leads, and conversion performance.
  • Support management decision-making.

Tools Used

Microsoft Excel, Power Query, Power Pivot, DAX Measures, Pivot Tables, and data visualization.

Recommendations

  • Strengthen budget monitoring processes.
  • Investigate delays in Residential Estate A.
  • Improve planning and resource allocation.
  • Replicate successful conversion strategies from Abuja.

Project 4

Sprocket Central Sales Performance

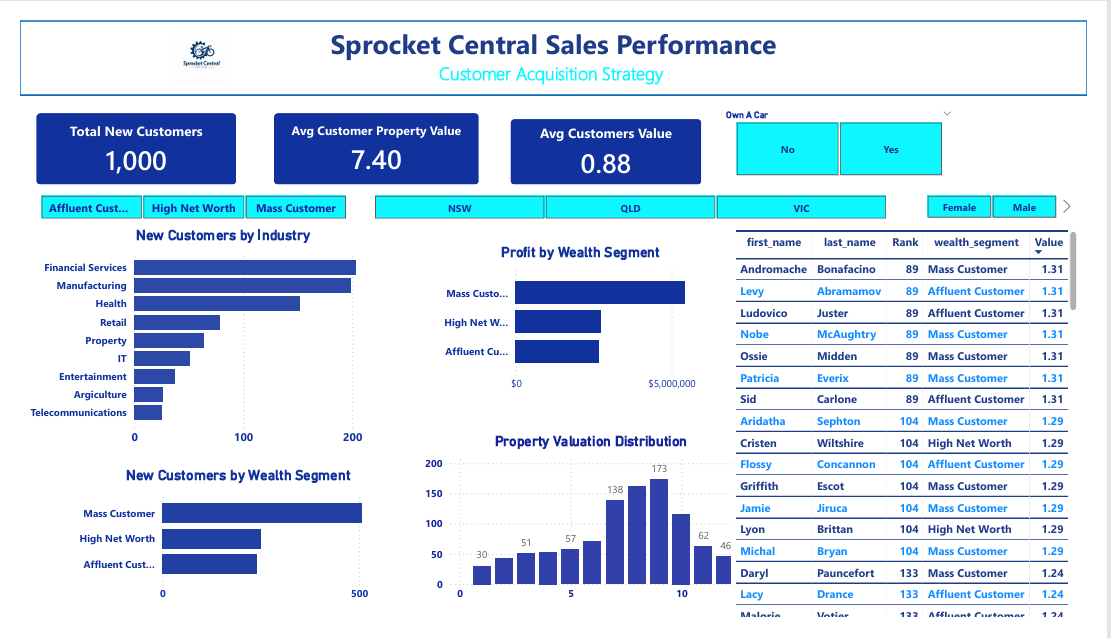
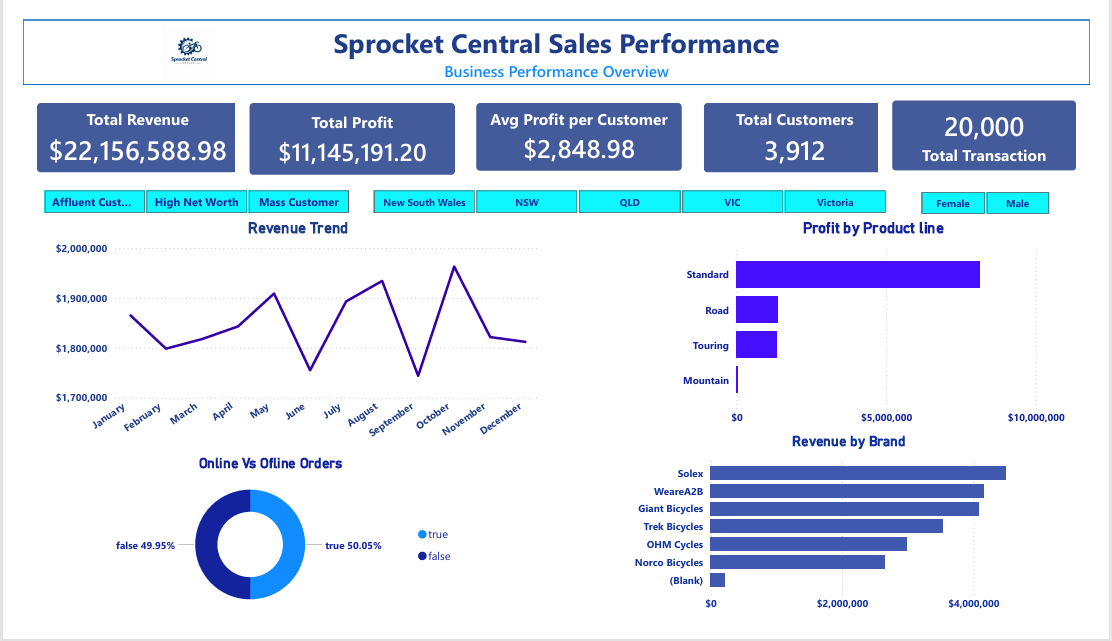
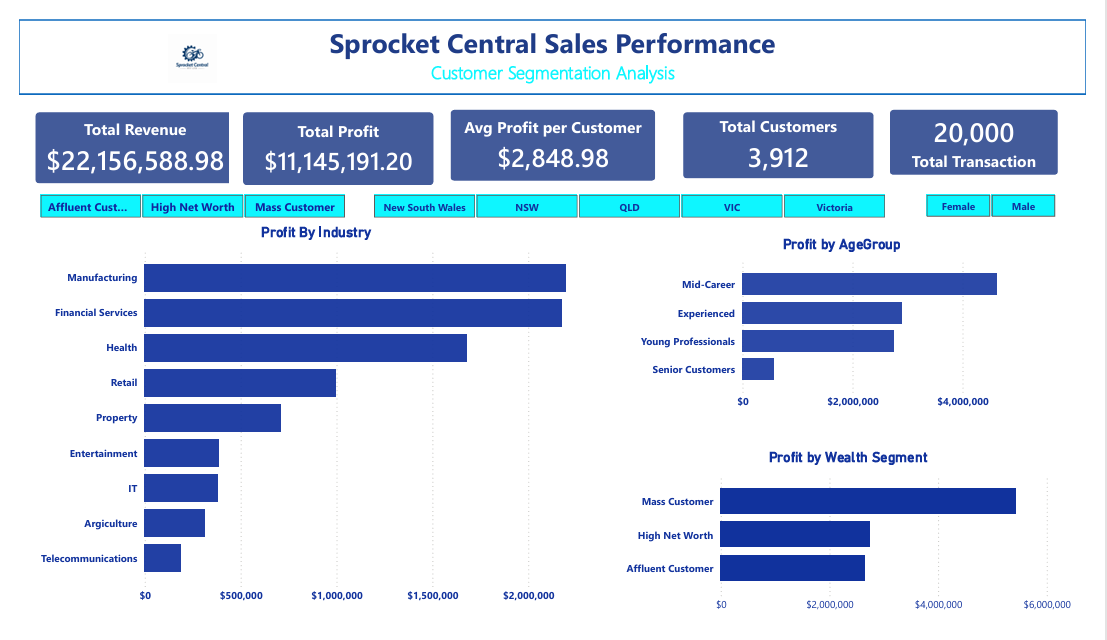
This project analyzes Sprocket Central's sales performance, customer segments, acquisition strategy, and profitability using interactive dashboard visuals.
Objective

Analyze sales and customer data to identify profitable customer groups, acquisition trends, and growth strategies.

Key Metrics

  • Total Revenue
  • Total Profit
  • Average Profit per Customer
  • Total Customers and Transactions
  • Total New Customers

Key Insights

  • Total revenue was over $22 million.
  • Mass Customers generated the highest profit among wealth segments.
  • Mid-Career customers contributed the highest profit by age group.
  • Manufacturing and Financial Services performed strongly.

Recommendations

  • Focus campaigns on Mass Customers and Mid-Career customers.
  • Strengthen acquisition in strong-performing industries.
  • Promote high-performing product lines and brands.
  • Personalize marketing using customer segmentation.

Project 5

Superstore Sales Performance Dashboard

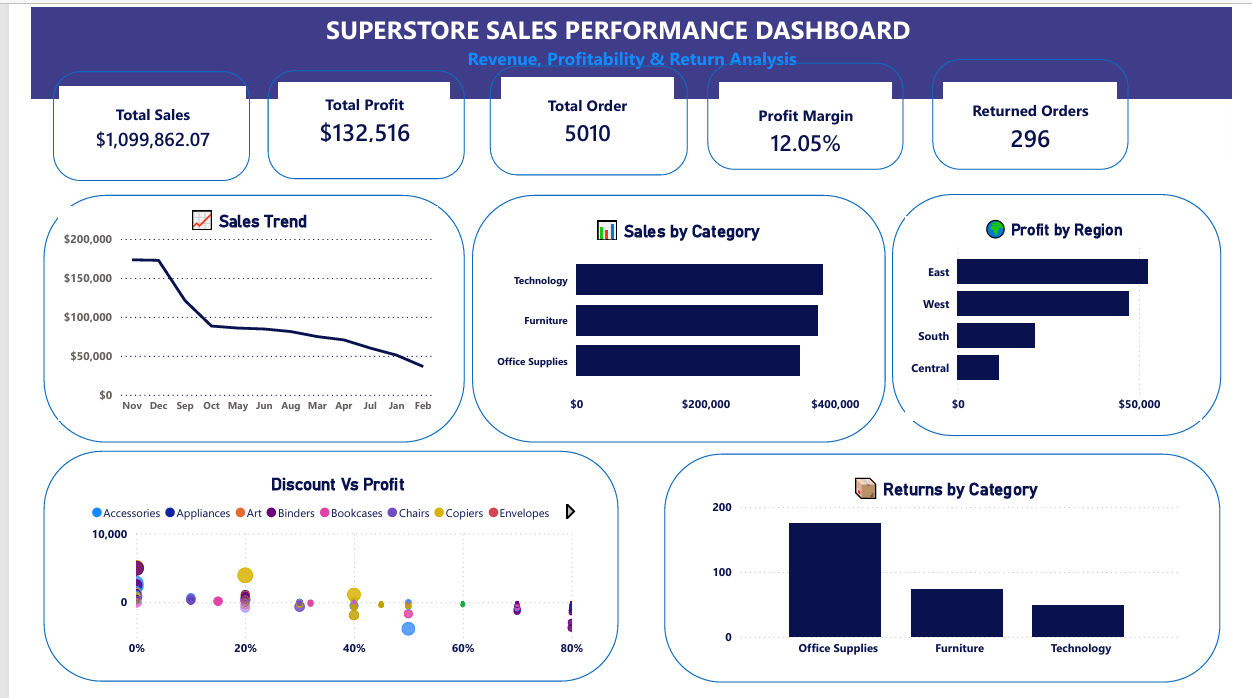
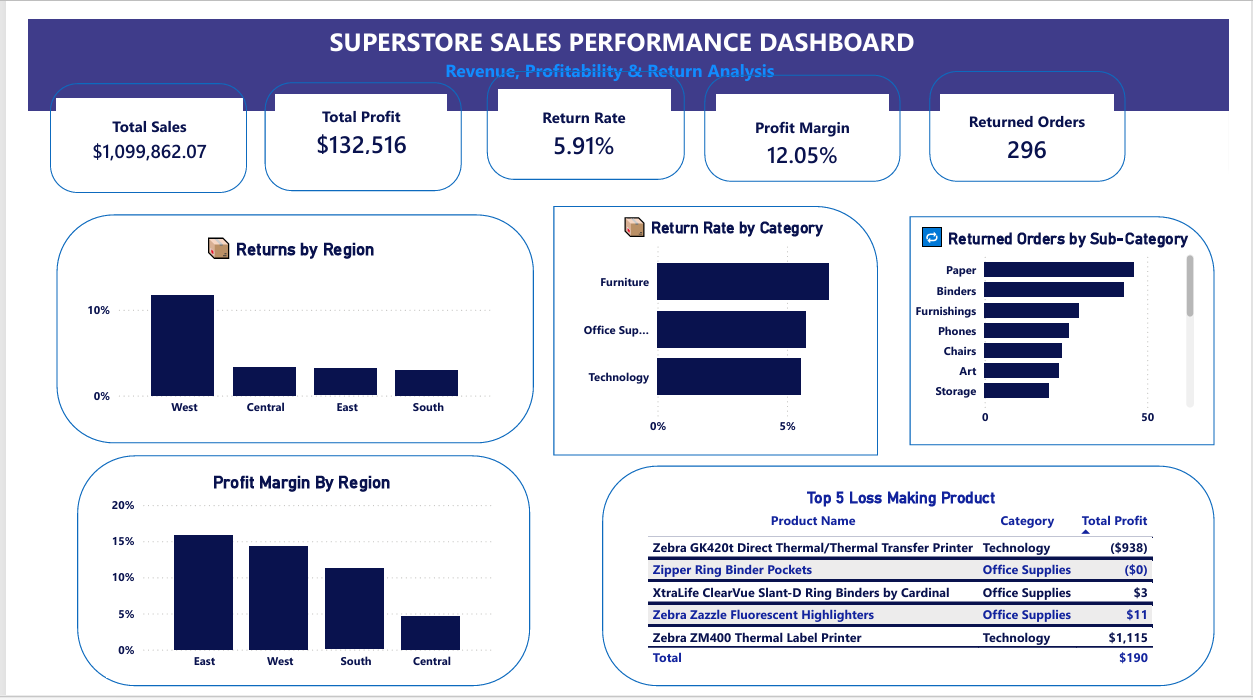
This project analyzes Superstore sales, profit, return rate, and product performance using an interactive Power BI dashboard.
Problem

  • Identify products and categories generating low profit.
  • Understand return rates by category and sub-category.
  • Evaluate how returned orders affect profitability.

Key Metrics

  • Total Sales
  • Total Profit
  • Total Orders
  • Profit Margin
  • Return Rate and Returned Orders

Key Insights

  • Total sales were over $1 million.
  • Profit margin was 12.05%.
  • Office Supplies had the highest return count.
  • East and West regions generated stronger profit.

Recommendations

  • Investigate products with high returns and negative profit.
  • Reduce discounts on low-profit products.
  • Focus sales efforts on high-performing regions.
  • Track return rate regularly.

Project 6

Brewery Sales SQL Analysis

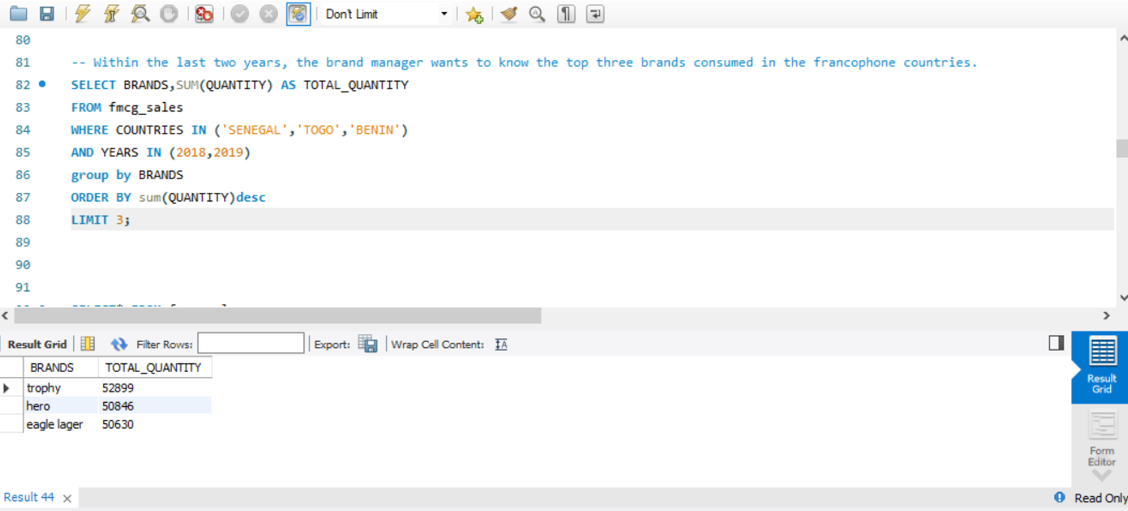
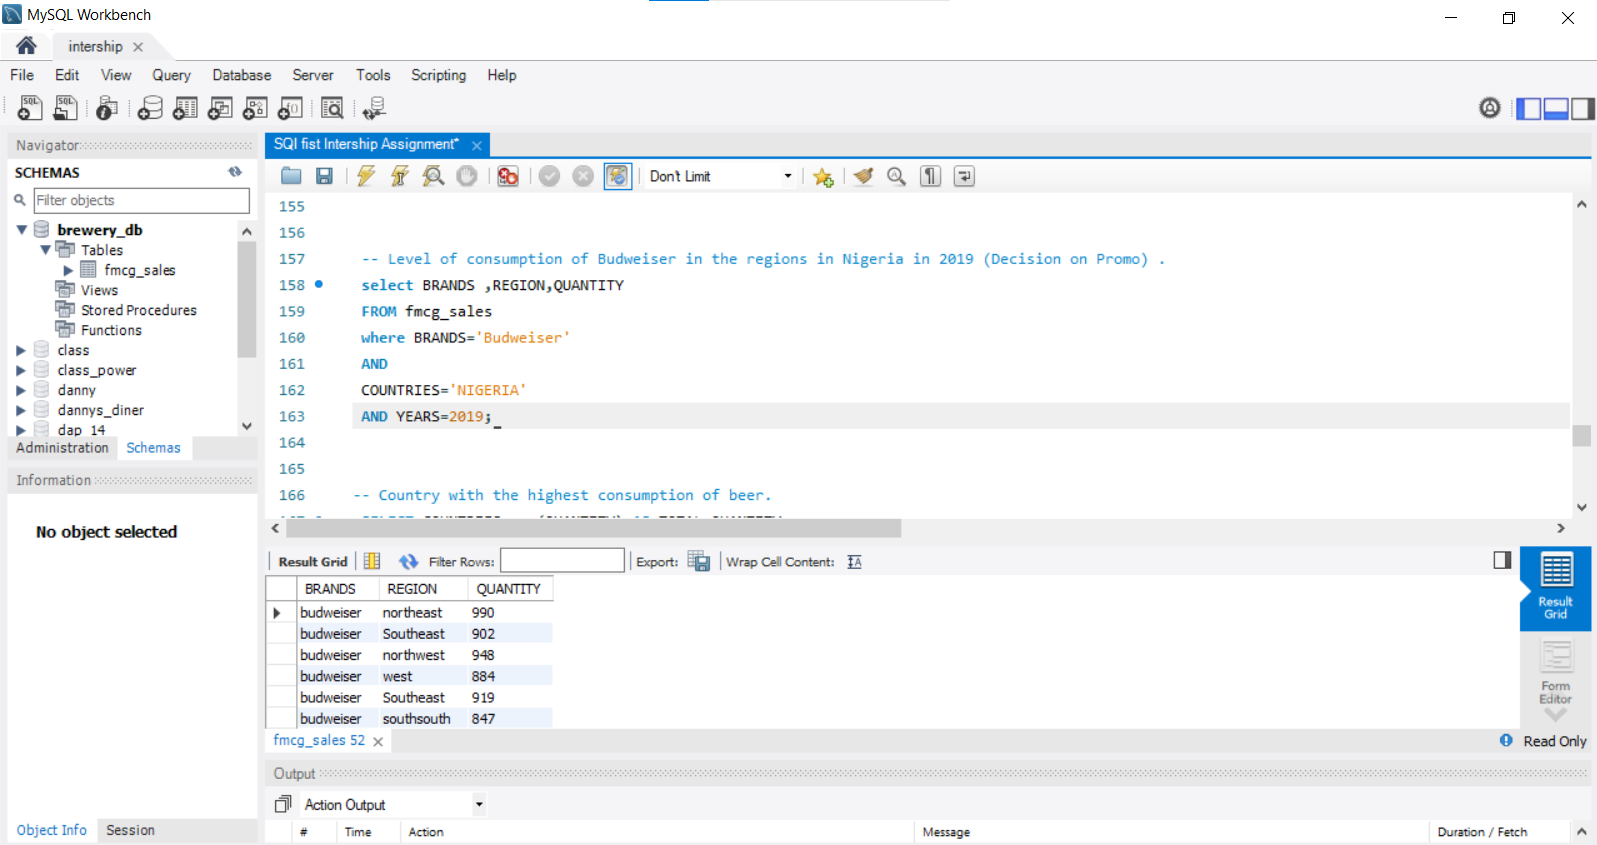
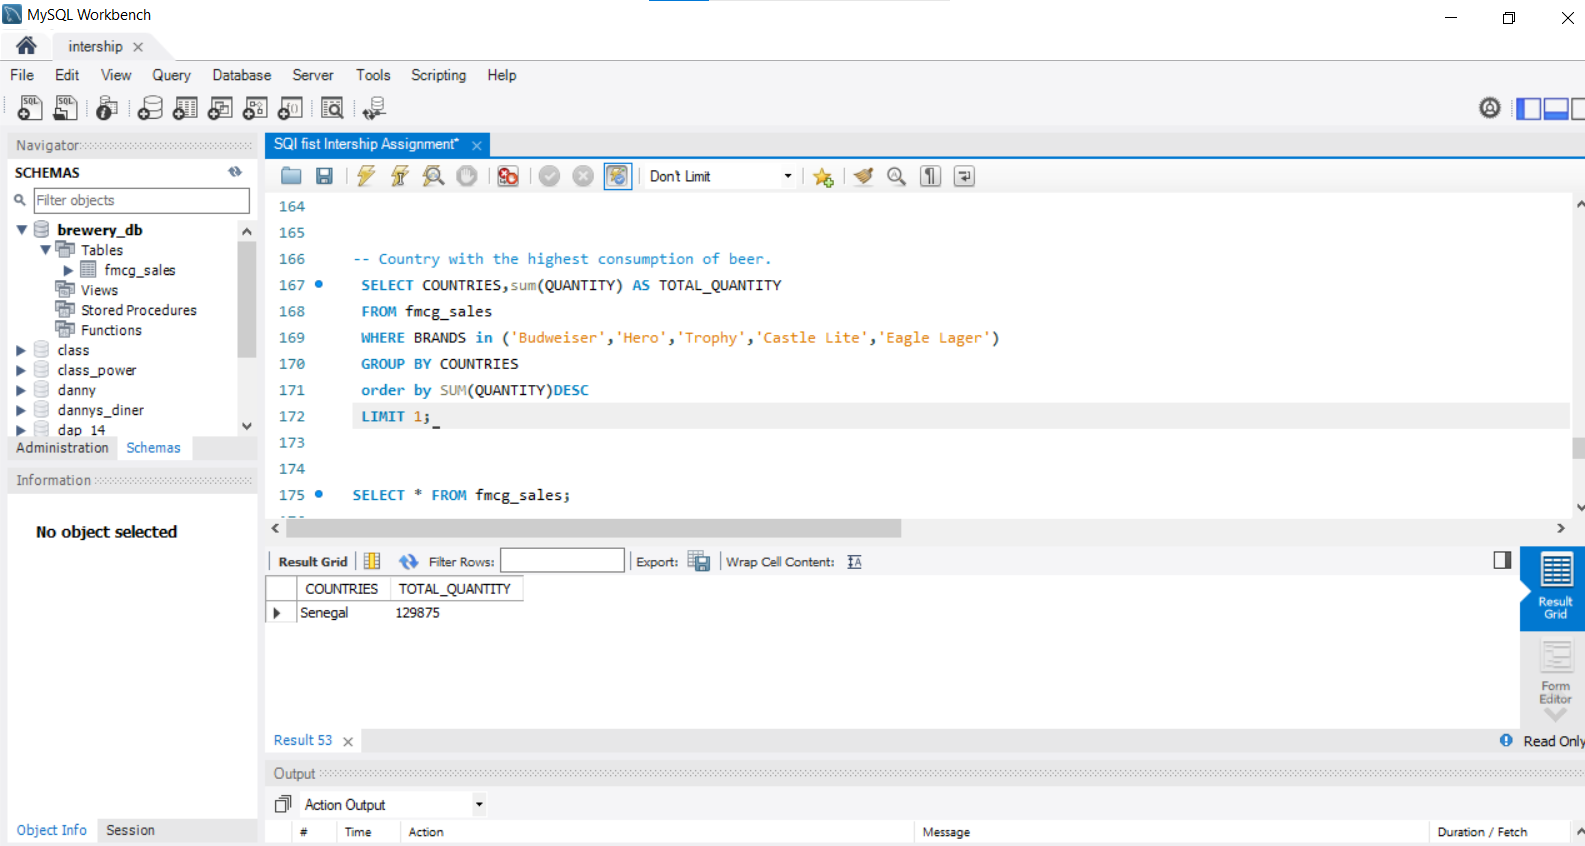
This project uses MySQL to answer business questions about product consumption, country performance, sales representatives, and profit trends.
SQL Skills Applied

  • SELECT statements
  • WHERE and AND filtering
  • GROUP BY and ORDER BY
  • SUM aggregation
  • LIMIT

Questions Answered

  • Budweiser consumption by region in Nigeria in 2019.
  • Country with the highest beer consumption.
  • Best sales representative for Budweiser in Senegal.
  • Country with the highest Q4 profit in 2019.

Key Insights

  • Budweiser demand varied across Nigerian regions.
  • Senegal recorded the highest consumption among selected brands.
  • SQL made it easy to filter and summarize large sales data.

Recommendations

  • Focus distribution on high-consumption countries.
  • Monitor Budweiser performance by region.
  • Study top-performing sales representatives.
  • Use quarterly profit analysis for planning.

Project 7

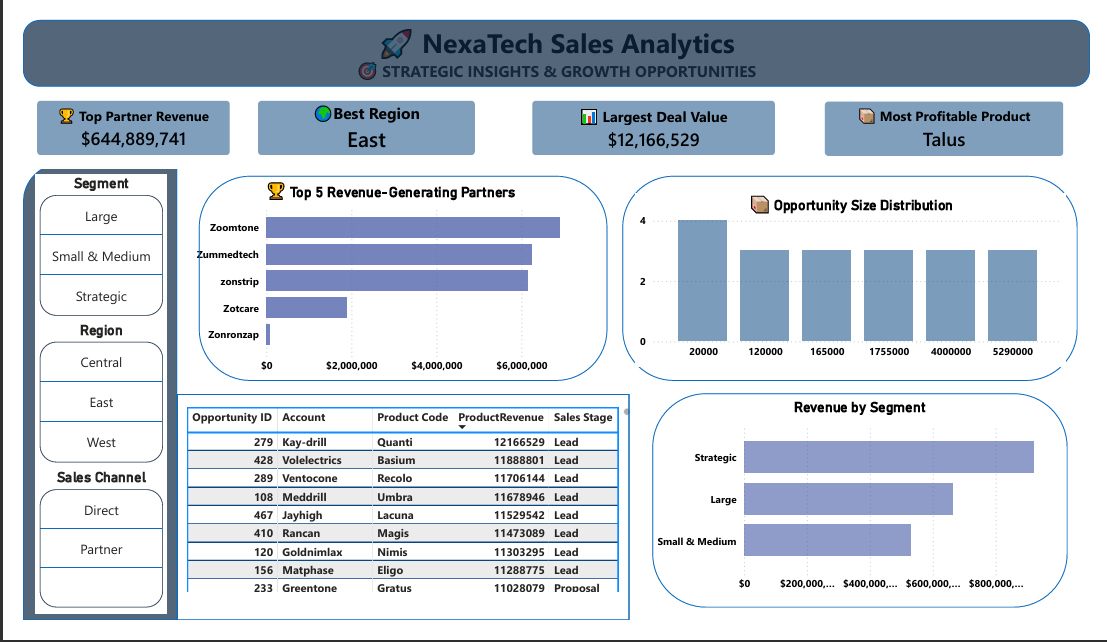
NexaTech Sales Analytics Dashboard

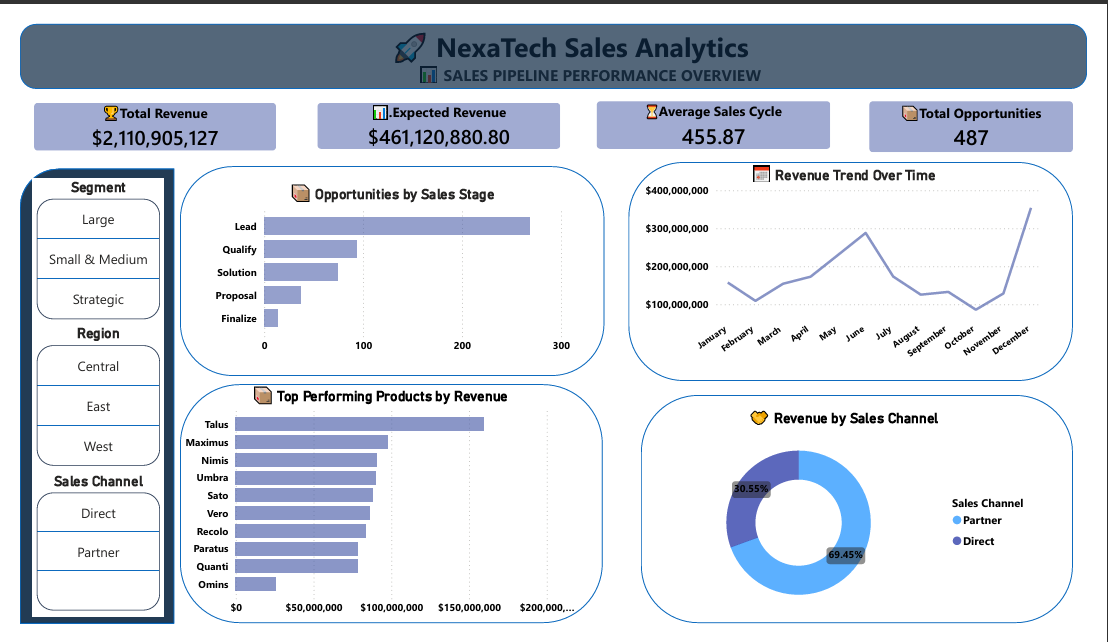
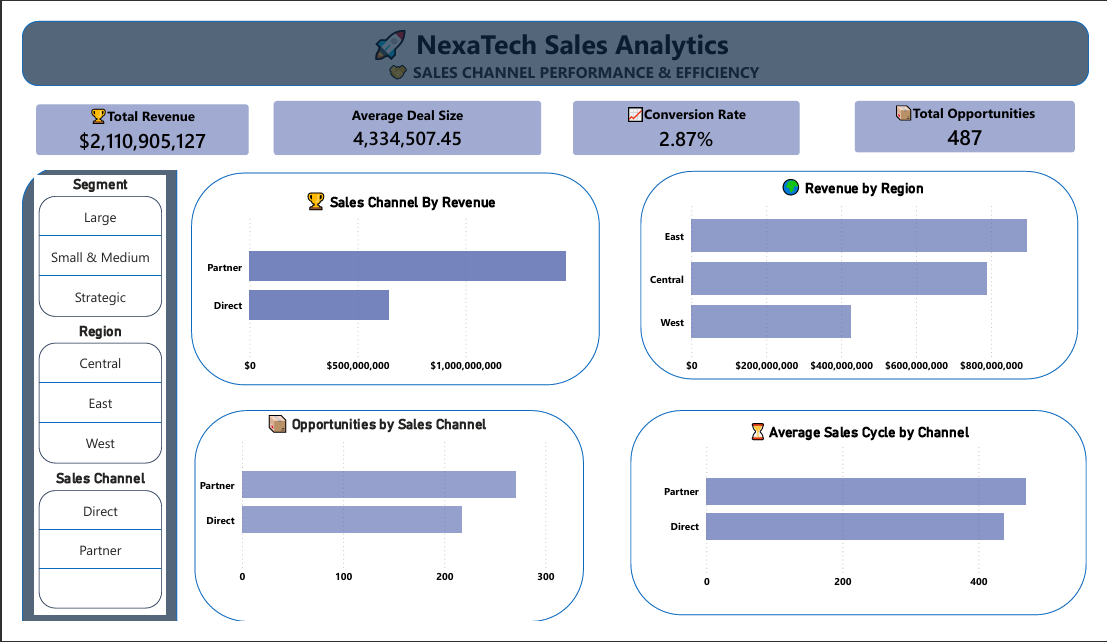
This project analyzes NexaTech's sales pipeline, revenue performance, sales channels, partners, and growth opportunities using Power BI.
Objective

Evaluate sales pipeline performance, channel efficiency, revenue trends, and strategic growth opportunities.

Key Metrics

  • Total Revenue and Expected Revenue
  • Average Sales Cycle
  • Total Opportunities
  • Conversion Rate and Average Deal Size
  • Best Region and Most Profitable Product

Key Insights

  • Total revenue was over $2.1 billion.
  • Partner channel generated higher revenue than direct sales.
  • East was identified as the best region.
  • Talus was the most profitable product.

Recommendations

  • Strengthen partner channel relationships.
  • Focus more sales efforts on the East region.
  • Prioritize high-performing products such as Talus.
  • Improve follow-up on Lead and Qualify stage opportunities.